Navigating the AI Frontier: Leading vs. Lagging Indicators
3/6/20262 min read


In the world of AI and Machine Learning, many leaders feel like they are flying a plane in thick fog. You see the "landing" (the results) clearly once you’ve hit the ground, but knowing if you’re on the right trajectory during the flight is much harder.
To build a sustainable AI growth engine, you need to distinguish between what happened yesterday and what is likely to happen tomorrow.
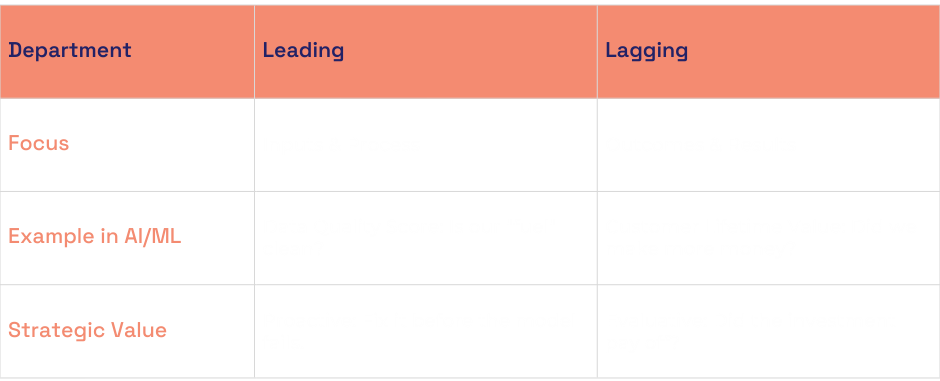
1. The Rearview Mirror: Lagging Indicators
Lagging indicators tell you what has already happened. They are easy to measure and provide the ultimate proof of success, but they offer no opportunity for course correction.
For a C-suite executive, these are usually your "bottom line" metrics. In AI/ML, these might look like:
Actual Revenue Growth: The direct profit generated by a recommendation engine.
Churn Rate: The number of customers who left after you deployed a predictive model.
Model Accuracy: How well the AI performed on historical data last month.
The Catch: By the time a lagging indicator shows a problem, the damage is already done. You can't change last month's churn; you can only react to it.
2. The Crystal Ball: Leading Indicators
Leading indicators are predictive. They measure the inputs and activities that lead to those final results. They are the levers you can actually pull to change the outcome.
In AI, these focus on the "health" of the system before it reaches the customer:
Data Freshness: Is your AI learning from today's market or last year's? Old data leads to stale predictions.
Feature Velocity: How quickly is your team testing new "signals" to make the model smarter?
Inference Latency: How fast is the AI giving an answer? If it's too slow, users will abandon the product before the result even arrives.
Moving Forward
Leading indicators give you the agility to pivot. Lagging indicators give you the proof to scale. A healthy AI strategy requires a balance of both to ensure you aren't just building sophisticated technology, but a resilient business asset.
Where Numel Fits
This is precisely where Numel becomes useful for decision-makers.
Most organizations already have dashboards full of lagging indicators: revenue, churn, conversions, and utilization. The challenge is not a lack of data; it is the lack of structured ways to test what will influence those outcomes before they happen. Numel helps bridge that gap.
Instead of only reviewing past performance, Numel allows teams to structure and test decision scenarios using their own business data. Leaders can model how changes in variables, such as pricing, acquisition spend, retention improvements, operational constraints, or market signals, may influence future outcomes.
In practical terms, this means teams can:
Explore which leading indicators actually influence revenue or growth.
Test multiple scenarios before committing capital or strategy.
Identify risk signals earlier, before they appear in lagging metrics.
Turn scattered operational data into structured decision inputs.
The result is a shift in mindset: from reviewing what happened, to evaluating what is likely to happen and what can still be changed. For executives navigating AI and data initiatives, this moves the conversation away from technical model performance toward what actually matters: better, more confident business decisions.